
Recipe and Review Data Analysis
Data Science Python
Introduction
In this project, we analyze a merged dataset of recipes and user ratings from Food.com to understand which recipe features drive higher average ratings. After cleaning and merging the recipe and interaction files, our final dataset contains 234429 recipes with 26 columns of information, including preparation time, ingredient count, and parsed nutritional values such as calories and protein before performing imputation based on univariate analysis.
Readers should care because knowing which factors influence recipe popularity can help home cooks choose or modify recipes for the best chance of success—and assist recipe sites in surfacing higher‐quality content
Column Descriptions
Recipe Dataset
| Column Name | Description |
|---|---|
name | Recipe name |
id | Recipe ID |
minutes | Minutes to prepare recipe |
contributor_id | User ID who submitted this recipe |
submitted | Date recipe was submitted |
tags | Food.com tags for recipe |
nutrition | Nutrition information in the form [calories (#), total fat (PDV), sugar (PDV), sodium (PDV), protein (PDV), saturated fat (PDV), carbohydrates (PDV)]; PDV stands for “percentage of daily value” |
n_steps | Number of steps in recipe |
steps | Text for recipe steps, in order |
description | User-provided description |
Interaction Dataset
| Column Name | Description |
|---|---|
user_id | User ID |
recipe_id | Recipe ID |
date | Date of interaction |
rating | Rating given |
review | Review text |
Data Cleaning and Exploreatory Data Analysis
Data Cleaning
-
Merging: We left-joined the recipes and interactions tables on id/recipe_id.
-
Zero–Rating Imputation: All
rating == 0values were replaced with NaN, since a zero almost certainly indicates a missing or invalid review. -
Nutrition Parsing: The raw nutrition strings (e.g. “[422, 11, 6, …]”) were converted to lists via ast.literal_eval, then unpacked into separate columns: calories, total_fat, sugar, sodium, protein, saturated_fat, and carbohydrates.
-
Outlier Removal (minutes): We dropped any recipes with minutes < 1 or minutes > 10 000 to remove obvious data‐entry errors.
Note: This outlier removal was performed after visualizing the original results from the univariate analysis of the
minutescolumn, which revealed a few recipes with unusually high preparation times. This got us down to 234207 rows.
Univariate Analysis
We looked at the marginal distributions of our key predictors and response:
-
Preparation Time (minutes)
-
Preparation Time (minutes)
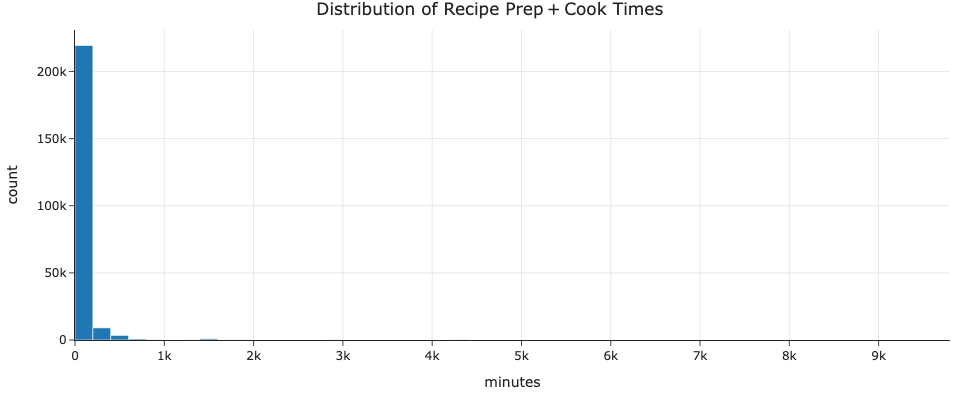
Most recipes take under an hour, with a long right‐hand tail of outliers (e.g. multi-day fermentations).
-
-
Average Rating (average_rating)
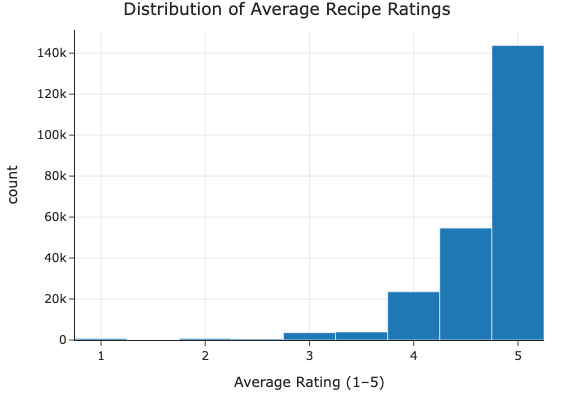
The average rating is skewed towards the upper range (4 - 5 stars), with a lean left tail. This suggests that most recipes are well-received, but there are some outliers with low ratings.
Ratings are heavily skewed toward the upper end (4–5 stars), indicating generally positive feedback.
Bivariate Analysis
Next, we examined pairwise scatter‐plots to see how features co‐vary with ratings:
- Prep Time vs. Average Rating
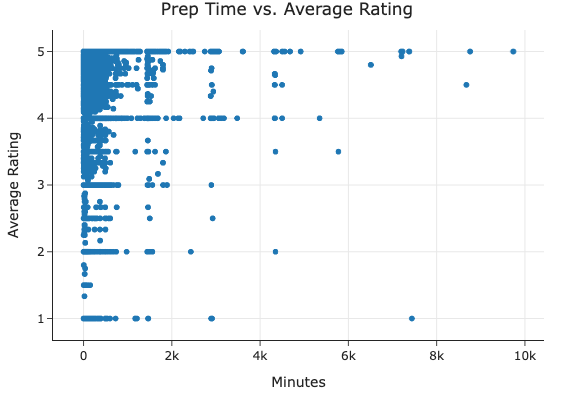
No clear linear trend—high and low ratings occur across all prep‐time ranges.
- Calories vs. Average Rating
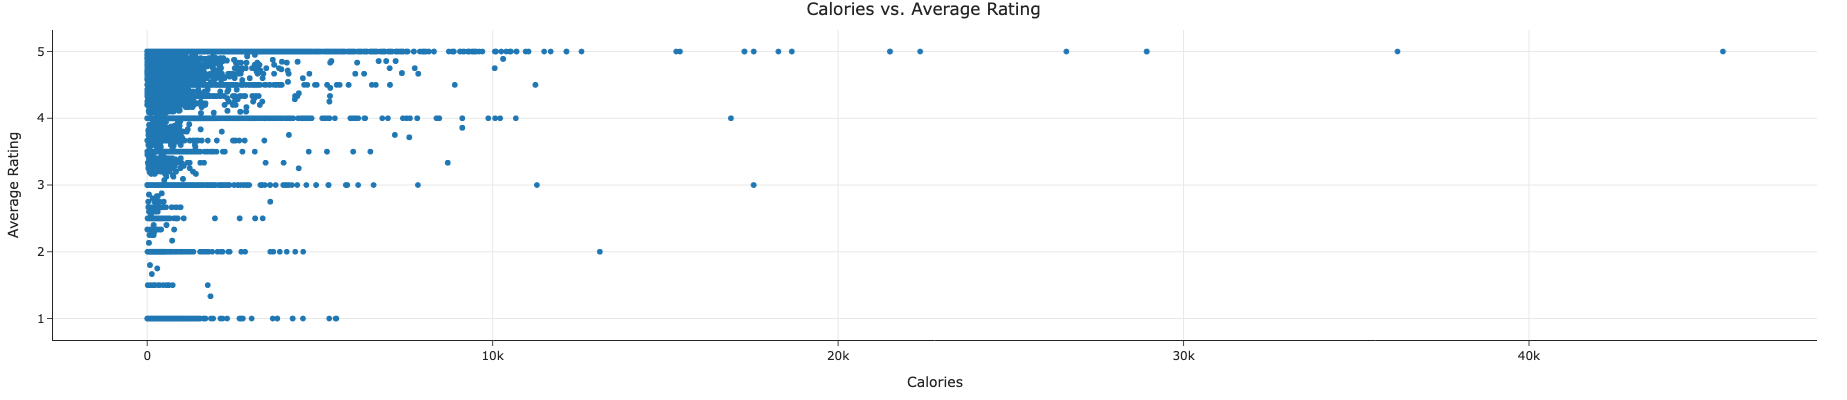
Similarly, calorie count alone does not predict how well a recipe will be received.
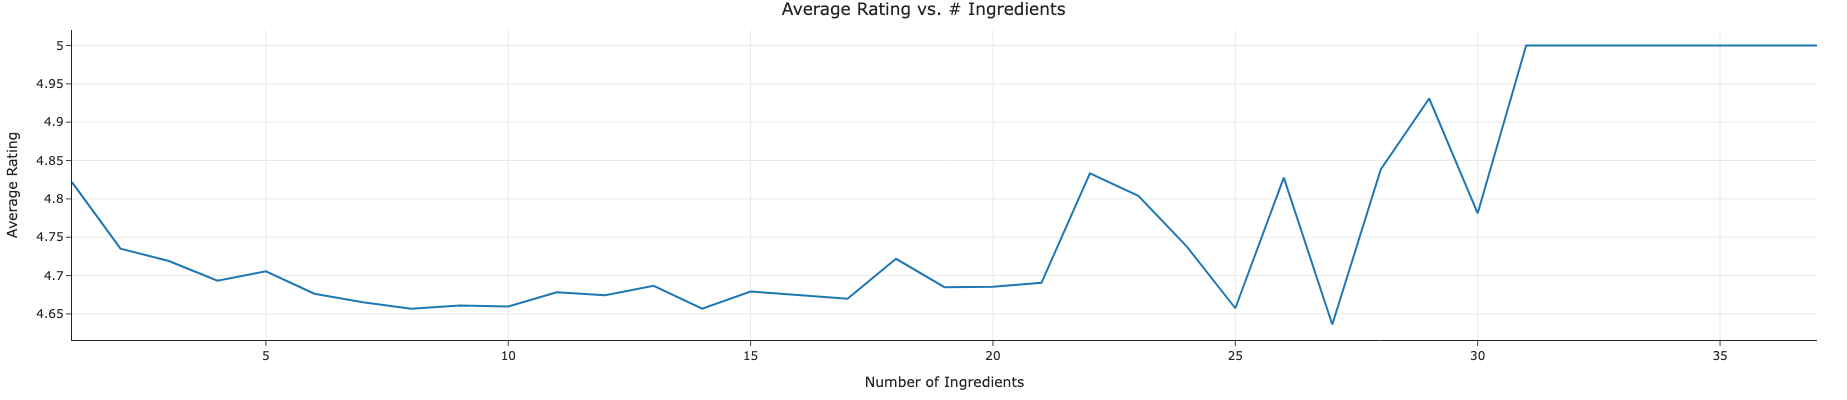
Intresting Aggregates
We aggregated mean ratings by ingredient count and by combined bins of prep time & ingredient quartile as well a basic plot to visualize average_rating vs. ingredient count.
-
Average Rating vs. # Ingredients
-
Pivot: Mean Rating by Prep‐Time Bin & Ingredient Quartile
| Minutes Bin | Q1 | Q2 | Q3 | Q4 |
|---|---|---|---|---|
| 0–15 | 4.73 | 4.68 | 4.73 | 4.73 |
| 16–30 | 4.68 | 4.67 | 4.67 | 4.69 |
| 31–60 | 4.68 | 4.65 | 4.66 | 4.68 |
| 61–120 | 4.68 | 4.66 | 4.67 | 4.69 |
| 120+ | 4.62 | 4.62 | 4.62 | 4.63 |
Ratings stay very stable (~4.6–4.7) across most combos, with a slight uptick for the longest, most complex recipes.
Imputation
-
Zero → NaN for rating to distinguish “no rating given” from an actual score of zero.
-
Outlier removal on minutes removed nonsensical extreme values.
-
No further imputation was needed for nutrient columns since any missing values correspond to genuinely missing nutrition info and are handled by our modeling pipeline.
Framing a Prediction Problem
Problem identification
For our modeling task, we will predict each recipe’s average user rating based on metadata (minutes, n_ingredients etc.) and nutritional information (calories etc.) that are known at the time of recipe submission.
Prediction Target: average_rating (mean rating per recipe)
Problem type: Regression (continuous outcome)
We chose regression because differences in rating (e.g. 4.2 vs. 4.7 stars) carry quantitative meaning and we want our model to capture incremental changes.
Features
Preparation time (minutes) – how long it takes to cook
Number of ingredients (n_ingredients) – recipe complexity
Calories (calories) – energy content
(We could also extend to protein, carbohydrates, etc., but start with these three core predictors.) All of these are available immediately when a user views a recipe (before any ratings are collected), so our model avoids data leakage.
Evaluation Metric
We will use Root Mean Squared Error (RMSE) on held-out data to measure how closely our predictions match the true average ratings. RMSE penalizes larger misses more heavily, which is appropriate since a half‐star error (e.g. predicting 4.0 when the true average is 4.5) is more serious than a small 0.1‐star error
Baseline Model
For our baseline, we built a simple Random Forest regression pipeline using only two features:
-
minutes(prep + cook time) - quantitative -
n_ingredients(number of ingredients) - quantitative
All missing values (though few remain after cleaning) are imputed with the median, and then fed directly into a RandomForestRegressor. The entire procedure is wrapped in a single scikit-learn Pipeline.
Train-test Split
We randomly split the cleaned data (only recipes with non-null average_rating) into:
-
80% training set
-
20% test set
using train_test_split(random_state=42) to ensure reproducibility.
Baseline Performance
After fitting on the training set and predicting on the test set, we obtained:
Baseline RMSE: 0.491
This means our baseline model’s predictions are off by about 0.49 stars on average.
An RMSE of ~0.5 stars is a moderate starting point: our model captures some signal (better than predicting the overall mean, which yields RMSE ≈ 0.70), but there remains substantial room for improvement.
We expect that adding more informative features—such as derived nutritional ratios or logarithmic transforms—will help reduce error in the final model.
Final Model
Feature Engineering
To capture nonlinearities and normalize by recipe complexity, we created two new features in addition to our original three:
-
log_minutes= log1p(minutes) Reduces skew from long‐tail prep times and emphasizes relative differences among shorter recipes. -
cal_per_ing= calories / n_ingredients Measures average calorie density per ingredient, rather than total calories alone.
Full feature set:
minutes(prep + cook time) - quantitativen_ingredients(number of ingredients) - quantitativecalories(total calories) - quantitativelog_minutes(log1p(minutes)) - quantitativecal_per_ing(calories / n_ingredients) - quantitative
Pipeline and Hyperparameter Tuning
We wrapped the feature transformer, median imputation, and Random Forest regressor into a single Pipeline, then performed a grid search over two key hyperparameters
n_estimators(number of trees in the forest) to balance bias and variancemax_depth(maximum depth of each tree) to control overfitting
We used GridSearchCV with 5-fold cross-validation to find the best combination of hyperparameters.
The best parameters were:
rf__n_estimators = 200
rf__max_depth    = None
CV_RMSE          = 0.3906
Test_RMSE        = 0.3724
Test Set Evaluation
Using the optimal model retrained on the full training set, we evaluated on the held-out test data:
Final RMSE: 0.3724
This is a 24% reduction in error relative to our baseline (0.491 → 0.372), demonstrating that our engineered features capture additional signal about user ratings.
Interpretation
log_minutes: Accounting for diminishing returns in recipe length—once prep time exceeds a threshold, additional minutes matter less to users.
cal_per_ing: Recipes with unusually high or low calorie density per ingredient often diverge from user expectations (e.g. very rich vs. very light dishes) and are thus more predictable.
The large number of trees (n_estimators=200) and unconstrained depth allow the model to flexibly fit complex interactions among preparation time, ingredient count, and nutrition without over‐pruning.
Overall, these thoughtfully engineered features and hyperparameter choices yield a substantially better fit than a vanilla two‐feature baseline, moving us closer to actionable insights on what makes recipes highly rated.
Bringing together our exploration and modeling of Food.com recipes, we have shown that:
-
After merging recipes with their user interactions and parsing key nutrition fields, we discovered that most recipes receive high ratings (4–5 stars) and cluster under an hour of prep time.
-
Simple univariate and bivariate plots revealed no overwhelmingly obvious linear trends, motivating us to build a flexible model.
Baseline vs. Final Model
A two-feature Random Forest (prep time, ingredient count) yielded an RMSE of 0.491, already beating a naïve mean predictor.
By adding engineered features—log-transformed prep time (log_minutes) to tame skew, and calorie density (cal_per_ing) to normalize for recipe complexity—and tuning tree depth and ensemble size, we cut test-set error to 0.372 (a 24 % improvement).
Key Insights
-
Diminishing Returns on Time: Users penalize extremely long cook times less once prep exceeds a threshold; modeling this with log_minutes captures that nuance.
-
Calorie Density Matters: Recipes that are unusually rich or light per ingredient carry distinct rating patterns compared to their plain‐count counterparts.
-
Recipe Complexity: Very simple recipes (few ingredients) tend to edge out mid-complexity dishes, but the most elaborate recipes can also command high ratings when they fulfill a niche.